Analytics can seem overwhelming for those not taking deep dives into the data on a daily basis. But it doesn’t have to include a steep learning curve. The best way to get started is to take a little time each day to learn and improve your skills. Here are a few ways to improve your analytics skills and gain some quick insights.
Learn how to combat referral SPAM
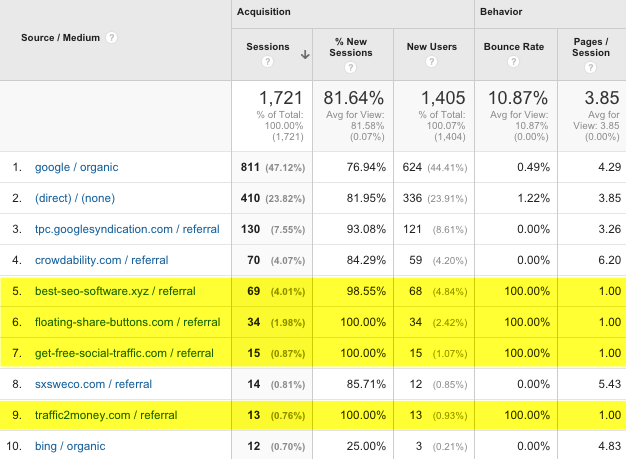
Before it’s possible to learn from your data, it’s important to make sure your data is accurate. Referral SPAM started to become a big problem this spring and it’s important to take care of it first. Referral SPAM produces fake referral traffic in your analytics reports and pollutes your data. The most common referral spam culprits are website referrals with names like darodar.com, semalt.com, buttons-for-website.com, but there are many others to be keep on your radar. Google has publicly said dealing with referral spam is a priority for them to address, but as of today it’s still up to us to deal with this bogus traffic (shown below).

Many blog posts have addressed how to deal with referral spam. I’d suggest taking some time to familiarize yourself with how to exclude this bogus traffic from your analytics reports. Here are a few good places to start:
- How to Stop Spam Bots from Ruining your Google Analytics Referral Data
- Quick Fix for Referral Spam in Google Analytics
- The Geek Guide to Removing Referral SPAM in Google Analytics
Start using the comparison tool to gain insights
Once referral spam is removed from your data it’s time to take advantage of the cool tools within Google Analytics. One of the most underused tools is the comparison tool. It allows you to quickly compare any metric to determine the best performing and identify which areas need some help. Here’s an example:

In this example, we’re using the comparison tool to examine the ecommerce conversion rates for mobile, desktop, and tablet. It looks like we have a great opportunity to improve the mobile ecommerce rate. It’s easy to examine a wide variety of metrics with the comparison tool. I’d recommend starting off by comparing browsers, operating systems, and operating system versions to make sure you’ve got your technical bases covered. Once your tech-check is complete, move on to campaigns, sources, referrals, and whatever else you think would make sense to compare. It’s a quick and easy way to discover what’s performing well (and what’s not).
Dive into Dashboards
Dashboards are a great way to discover insights without recurring effort on your part. But take the time to either build or borrow some great Google Analytics dashboards. They’re worth the time invested to create! Once built be sure to visit them on a regular basis. I make it a practice to schedule dashboard time to ensure I review them on a consistent basis to glean as much insight as possible. Earlier this year I wrote a five step guide to getting started with Google Analytics dashboards. There are also a lot of awesome dashboards in the Google Analytics Gallery, as well as here, here, and here. Have fun!
Getting started down the path of better understanding your website data is one way to be able to create better and better user experiences for your clients and a more productive website for your business. We wouldn’t let the shopping experience shown below happen in real life. Let’s make sure it doesn’t happen online as well.


